Intra-City Attraction Dynamics Series part 2
What if you could walk through every street in a city, evaluating greenery, facades, and pedestrian infrastructure, not just today, but tracking changes over the past decade? Our latest research does exactly that, using advanced computer vision to analyze millions of street-level images across European cities.
The Aesthetics Premium
Our findings reveal correlations between specific aesthetic improvements and subsequent property value changes. Neighborhoods showing improvements in greenery density, facade renovations, and reduction in graffiti experienced notable property value increases within 3-5 years. More importantly, these visual signals appeared well before traditional market indicators.
Consider Amsterdam’s Buikslotermeerplein, long considered an undesirable area with high crime rates. While traditional metrics still showed weakness, our street-level analysis detected subtle improvements in pedestrian infrastructure and greenery. The area has since shown increasing gentrification scores, despite maintaining its shopping center character and challenging reputation since the 1970s.
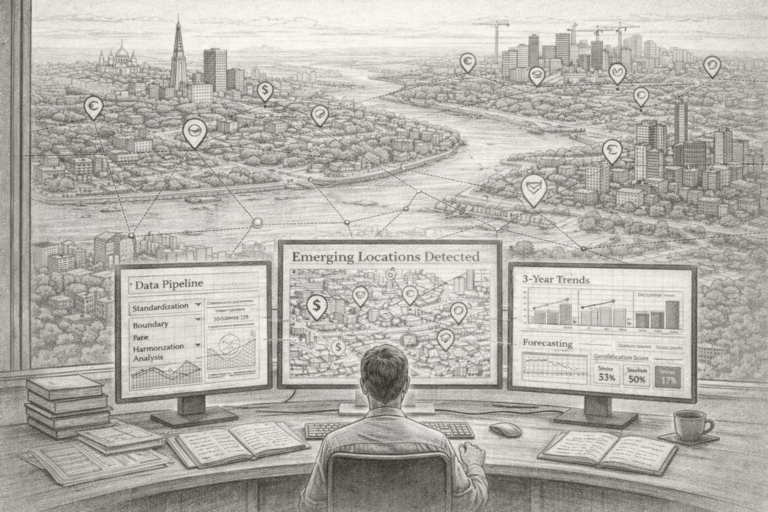
The Data Revolution
We’ve developed methods to track multiple dimensions of neighborhood change:
Greenery density changes: Trees, gardens, and green spaces visible from street level
Facade quality improvements: Building maintenance and renovation patterns
Pedestrian infrastructure: Sidewalk quality and pedestrian amenities
Unwanted elements: Graffiti, litter, and visible disrepair
Our analysis uses Large Vision Models to systematically evaluate these factors across 20 strategically sampled images per neighborhood, comparing periods before and after 2017.
Sentiment as a Leading Indicator
Beyond physical changes, we analyze sentiment from news outlets and social media to detect shifting neighborhood perceptions. Our system processes:
Local news coverage from NOS.nl (Netherlands) and ANSA.it (Italy), weighted heavily due to its authoritative nature
Reddit discussions across multiple subreddits, capturing grassroots opinions
Temporal patterns showing how sentiment shifts precede physical changes
In Utrecht’s Kanaleneiland, sentiment improvements were detected alongside physical changes, offering early signals for informed investors. The integration of news sentiment with social media provides a multi-dimensional view of neighborhood perception evolution.
The Amenity Evolution
We track not just the quantity but the quality transformation of neighborhood amenities. In Amsterdam, we have access to restaurant data spanning 16 years (2008-2024), revealing how commercial landscapes evolve. The challenge isn’t just counting establishments, it’s understanding the transition from snack bars to specialty coffee shops, from convenience stores to boutique retail.
Public Transport as Catalyst
Using GTFS (General Transit Feed Specification) data, we track public transport accessibility changes over time. The impact is dramatic, an example is Milan’s M4 metro line reportedly increased nearby property values by up to 60%. Our framework captures these infrastructure improvements before they’re fully priced into the market.
By analyzing transport stops and connectivity patterns, we identify neighborhoods poised for transformation as new connections reduce commute times and increase accessibility to employment centers.
The Predictive Power of Visual Data
The integration of these alternative data streams creates unprecedented predictive capabilities. While traditional models rely on lagging indicators like transaction prices and demographic shifts, our approach captures leading signals:
Physical improvements visible in streetview imagery
Sentiment shifts in news and social media
Amenity upgrades tracking commercial evolution
Infrastructure investments through transport data
For institutional investors, this means the ability to identify undervalued assets before market consensus forms, enabling entry at optimal price points in neighborhoods poised for transformation.