Hyperlocal City Reports
Deep-dive into city-level data and micro-location insights for precise investment decisions inside of cities.
Key characteristics
Cities
Granular data at street and neighbourhood level across three continents.
Data categories
Consistent, comparable data for any covered city, from socio-demographics to noise pollution.
Data sources
Data is aggregated from 1000+ of sources and standardised to compare cities.
Data catalogue
Quarterly updated indicators to retain recency.
Granular city-level insights
Hyperlocal City Reports let you zoom in from country level all the way down to individual neighborhood. The platform combines socio-demographic, mobility and thematic data, and amenity mapping to give you a 360-degree view of any micro-location in Europe, so you can compare neighbourhoods with the same rigour you apply to entire markets.
Whether you are sourcing new acquisitions, validating asset-level assumptions, or monitoring how the area around an existing holding is evolving, Hyperlocal City Reports give you the local context that macro data alone cannot provide.
Coverage
Hyperlocal City Reports cover big cities with data granularity down to individual neighbourhoods.
Countries and key cities
Western Europe
- Germany: Berlin, Munich, Frankfurt, Hamburg
- France: Paris, Lyon, Marseille, Toulouse
- Netherlands: Amsterdam, Rotterdam, The Hague
- United Kingdom: London, Manchester, Birmingham
- Ireland: Dublin, Cork
North America
- United States: New York, Austin, Boston, Detroit
- Canada: Ottawa, Montreal, Vancouver
Northern Europe
- Sweden: Stockholm, Gothenburg, Malmo
- Denmark: Copenhagen, Aarhus
- Norway: Oslo, Bergen
APAC
- Japan: Tokyo, Osaka, Kyoto
- Australia: Melbourne, Perth, Sydney
- New Zealand: Auckland, Wellington, Christchurch
- South Korea: Seoul, Busan, Incheon
Initial coverage includes 15+ countries and 200+ cities. This is a representative sample. Contact us for the full list.
Neighbourhood explorer
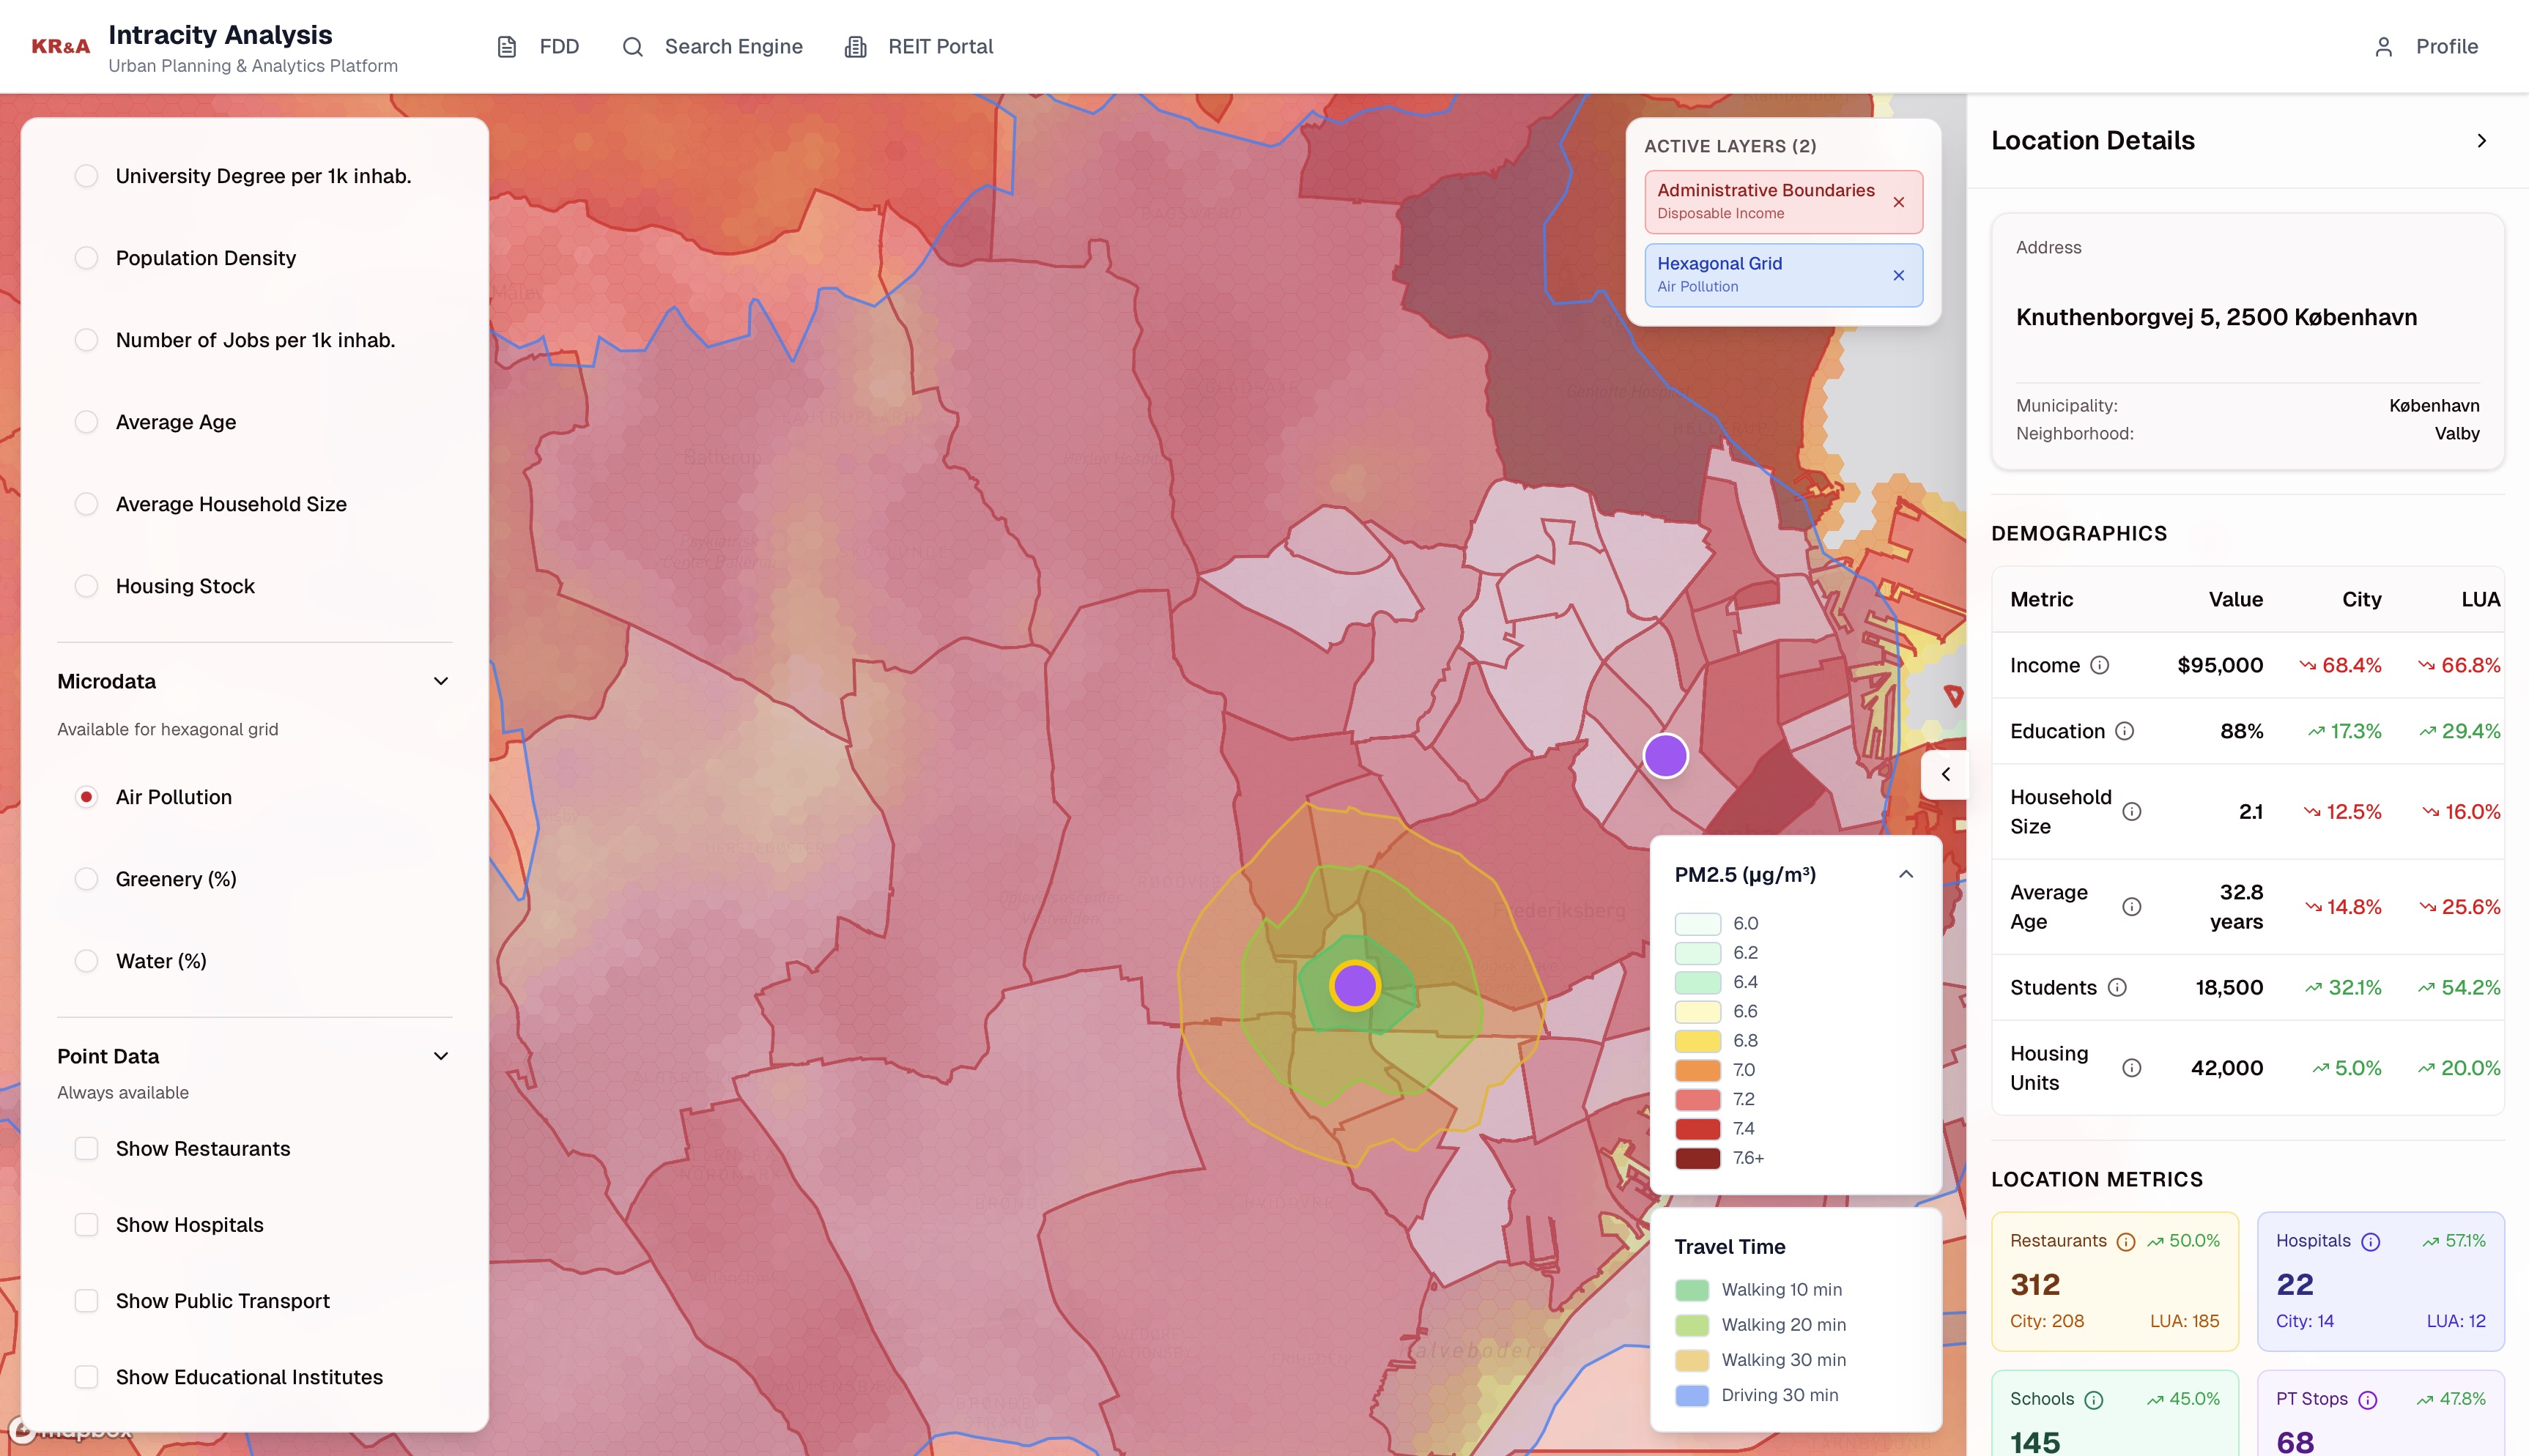
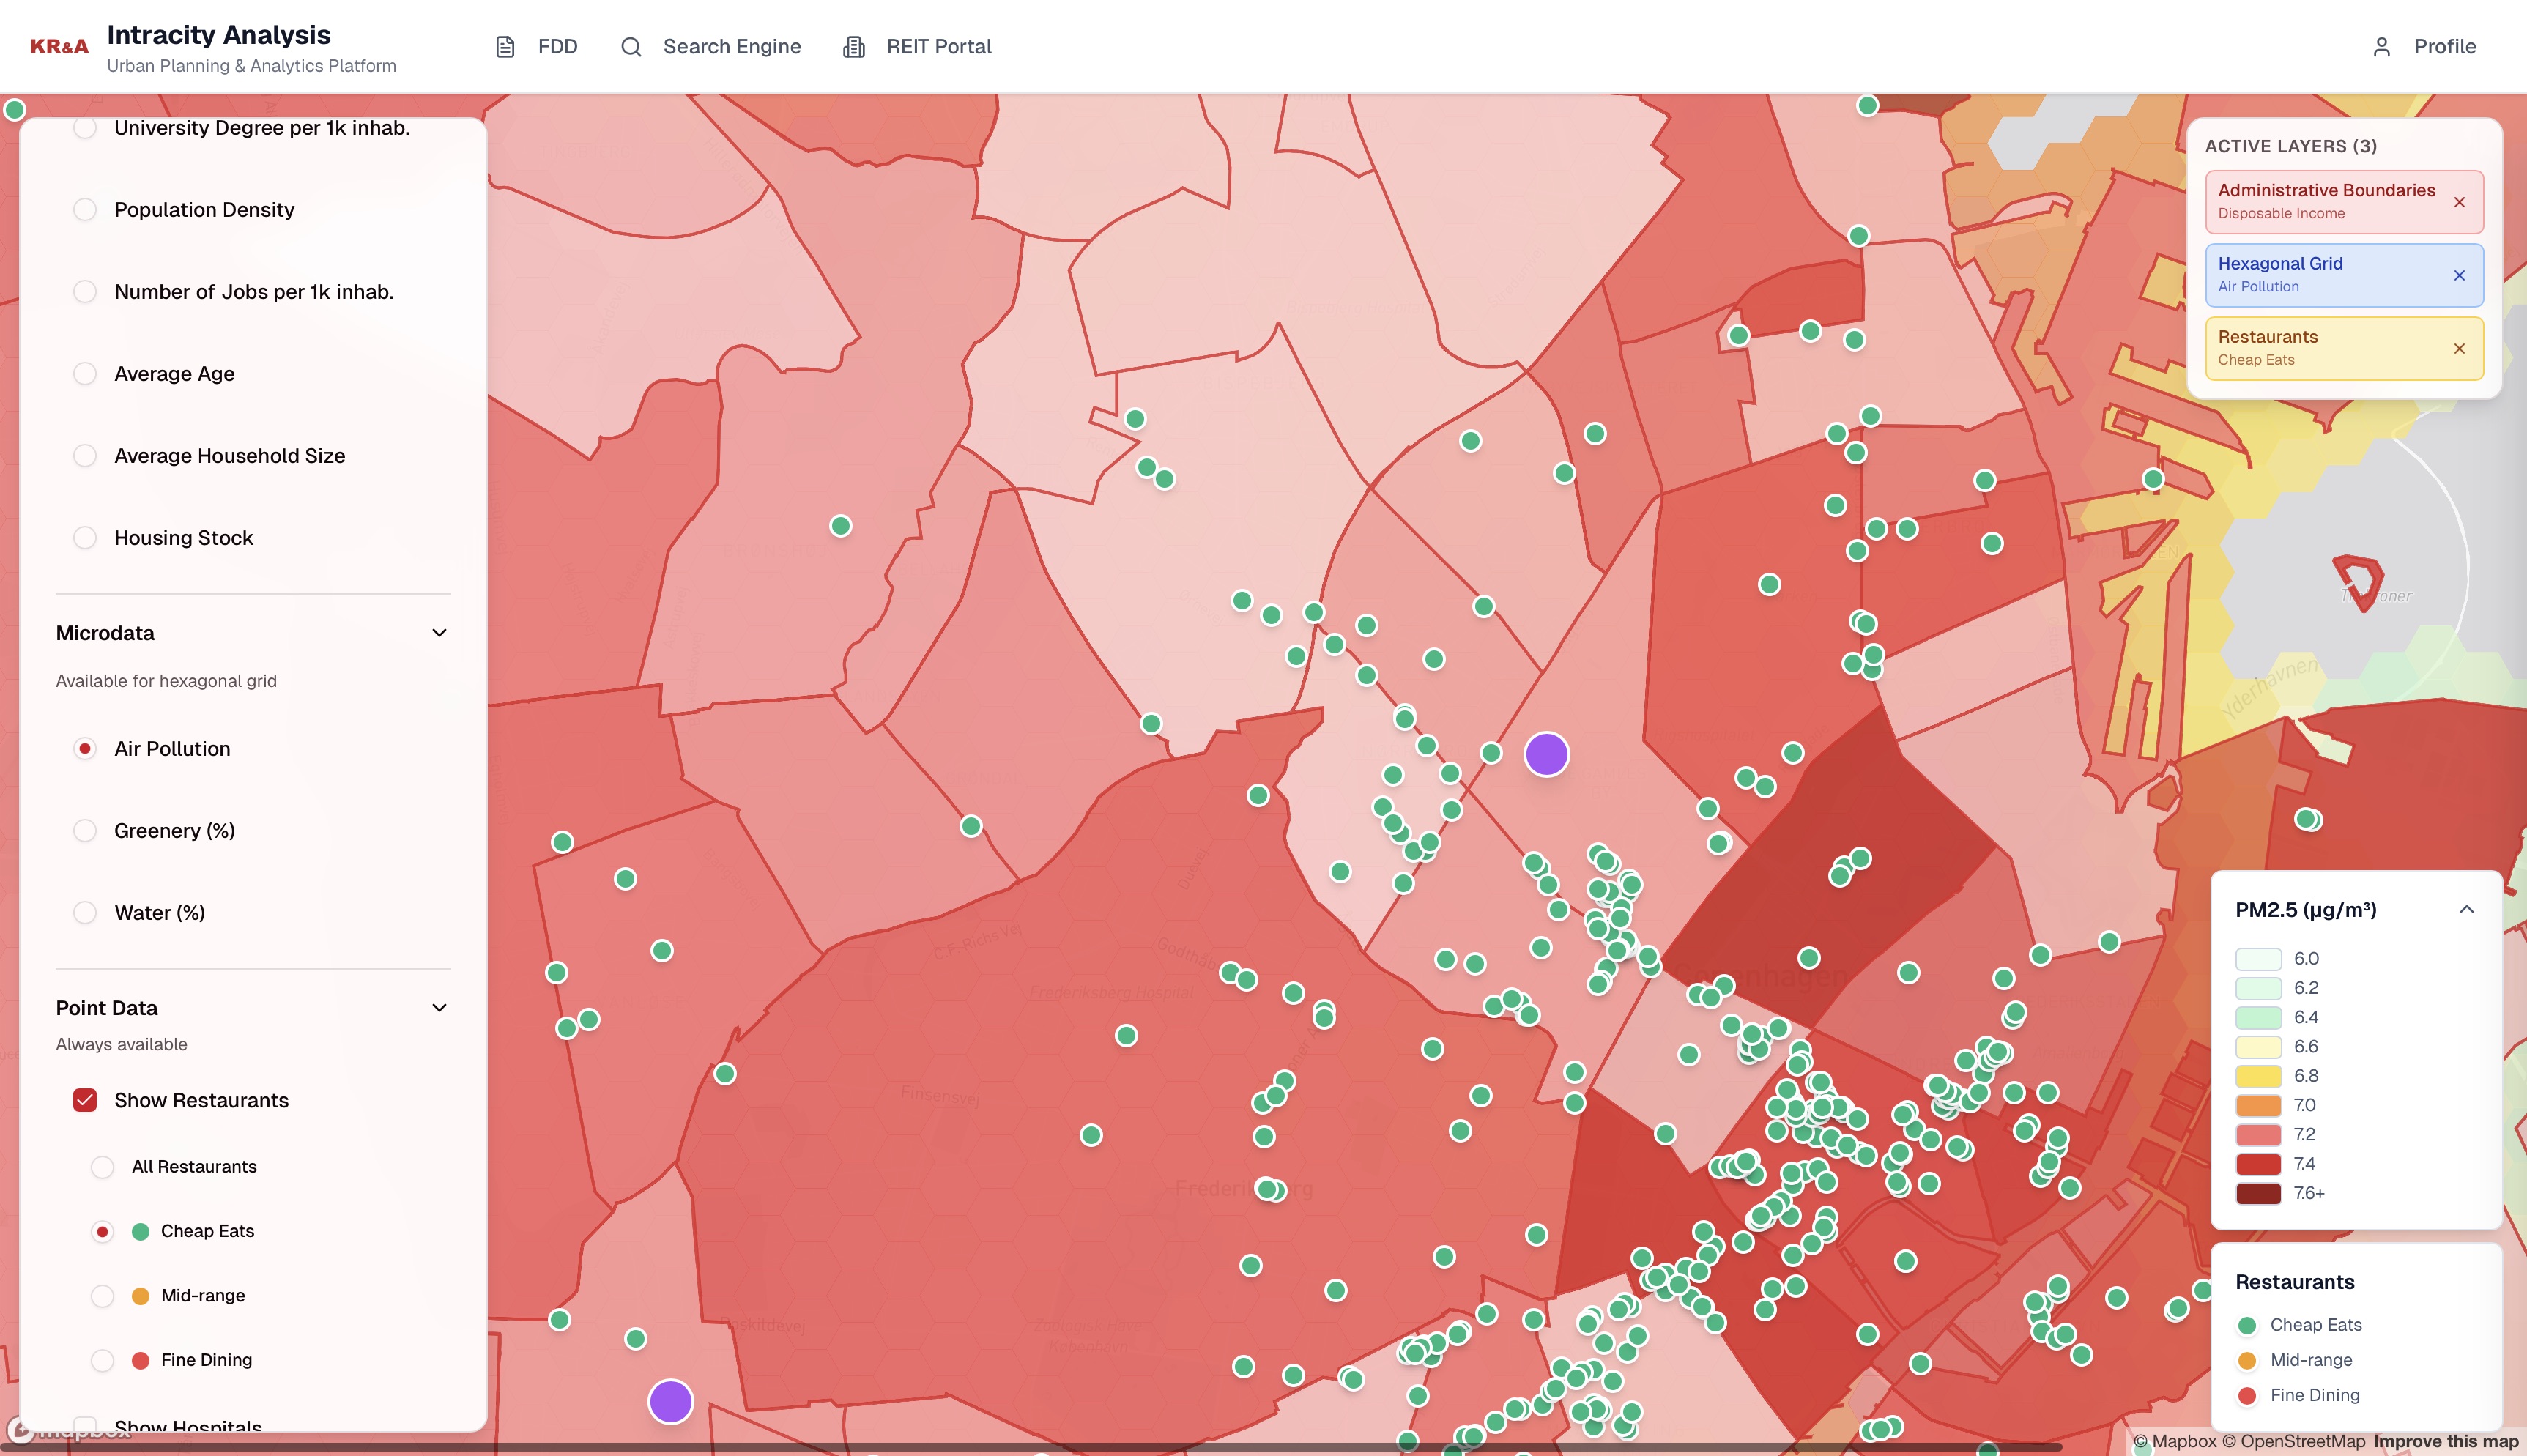
Browse any city at a neighborhood level. The map-based interface or provided data shows demographics, labour markets, income and population as a base map and overlays this with thematic maps of air quality, noise, green and water and POIs such as restaurants and public transport.
- •Socio-demographic data such as income, average age and education
- •Thematic maps on greenery, water, air quality and noise pollution
- •POI data on restaurants, public transport, schools etc.
Compare locations and neighborhoods
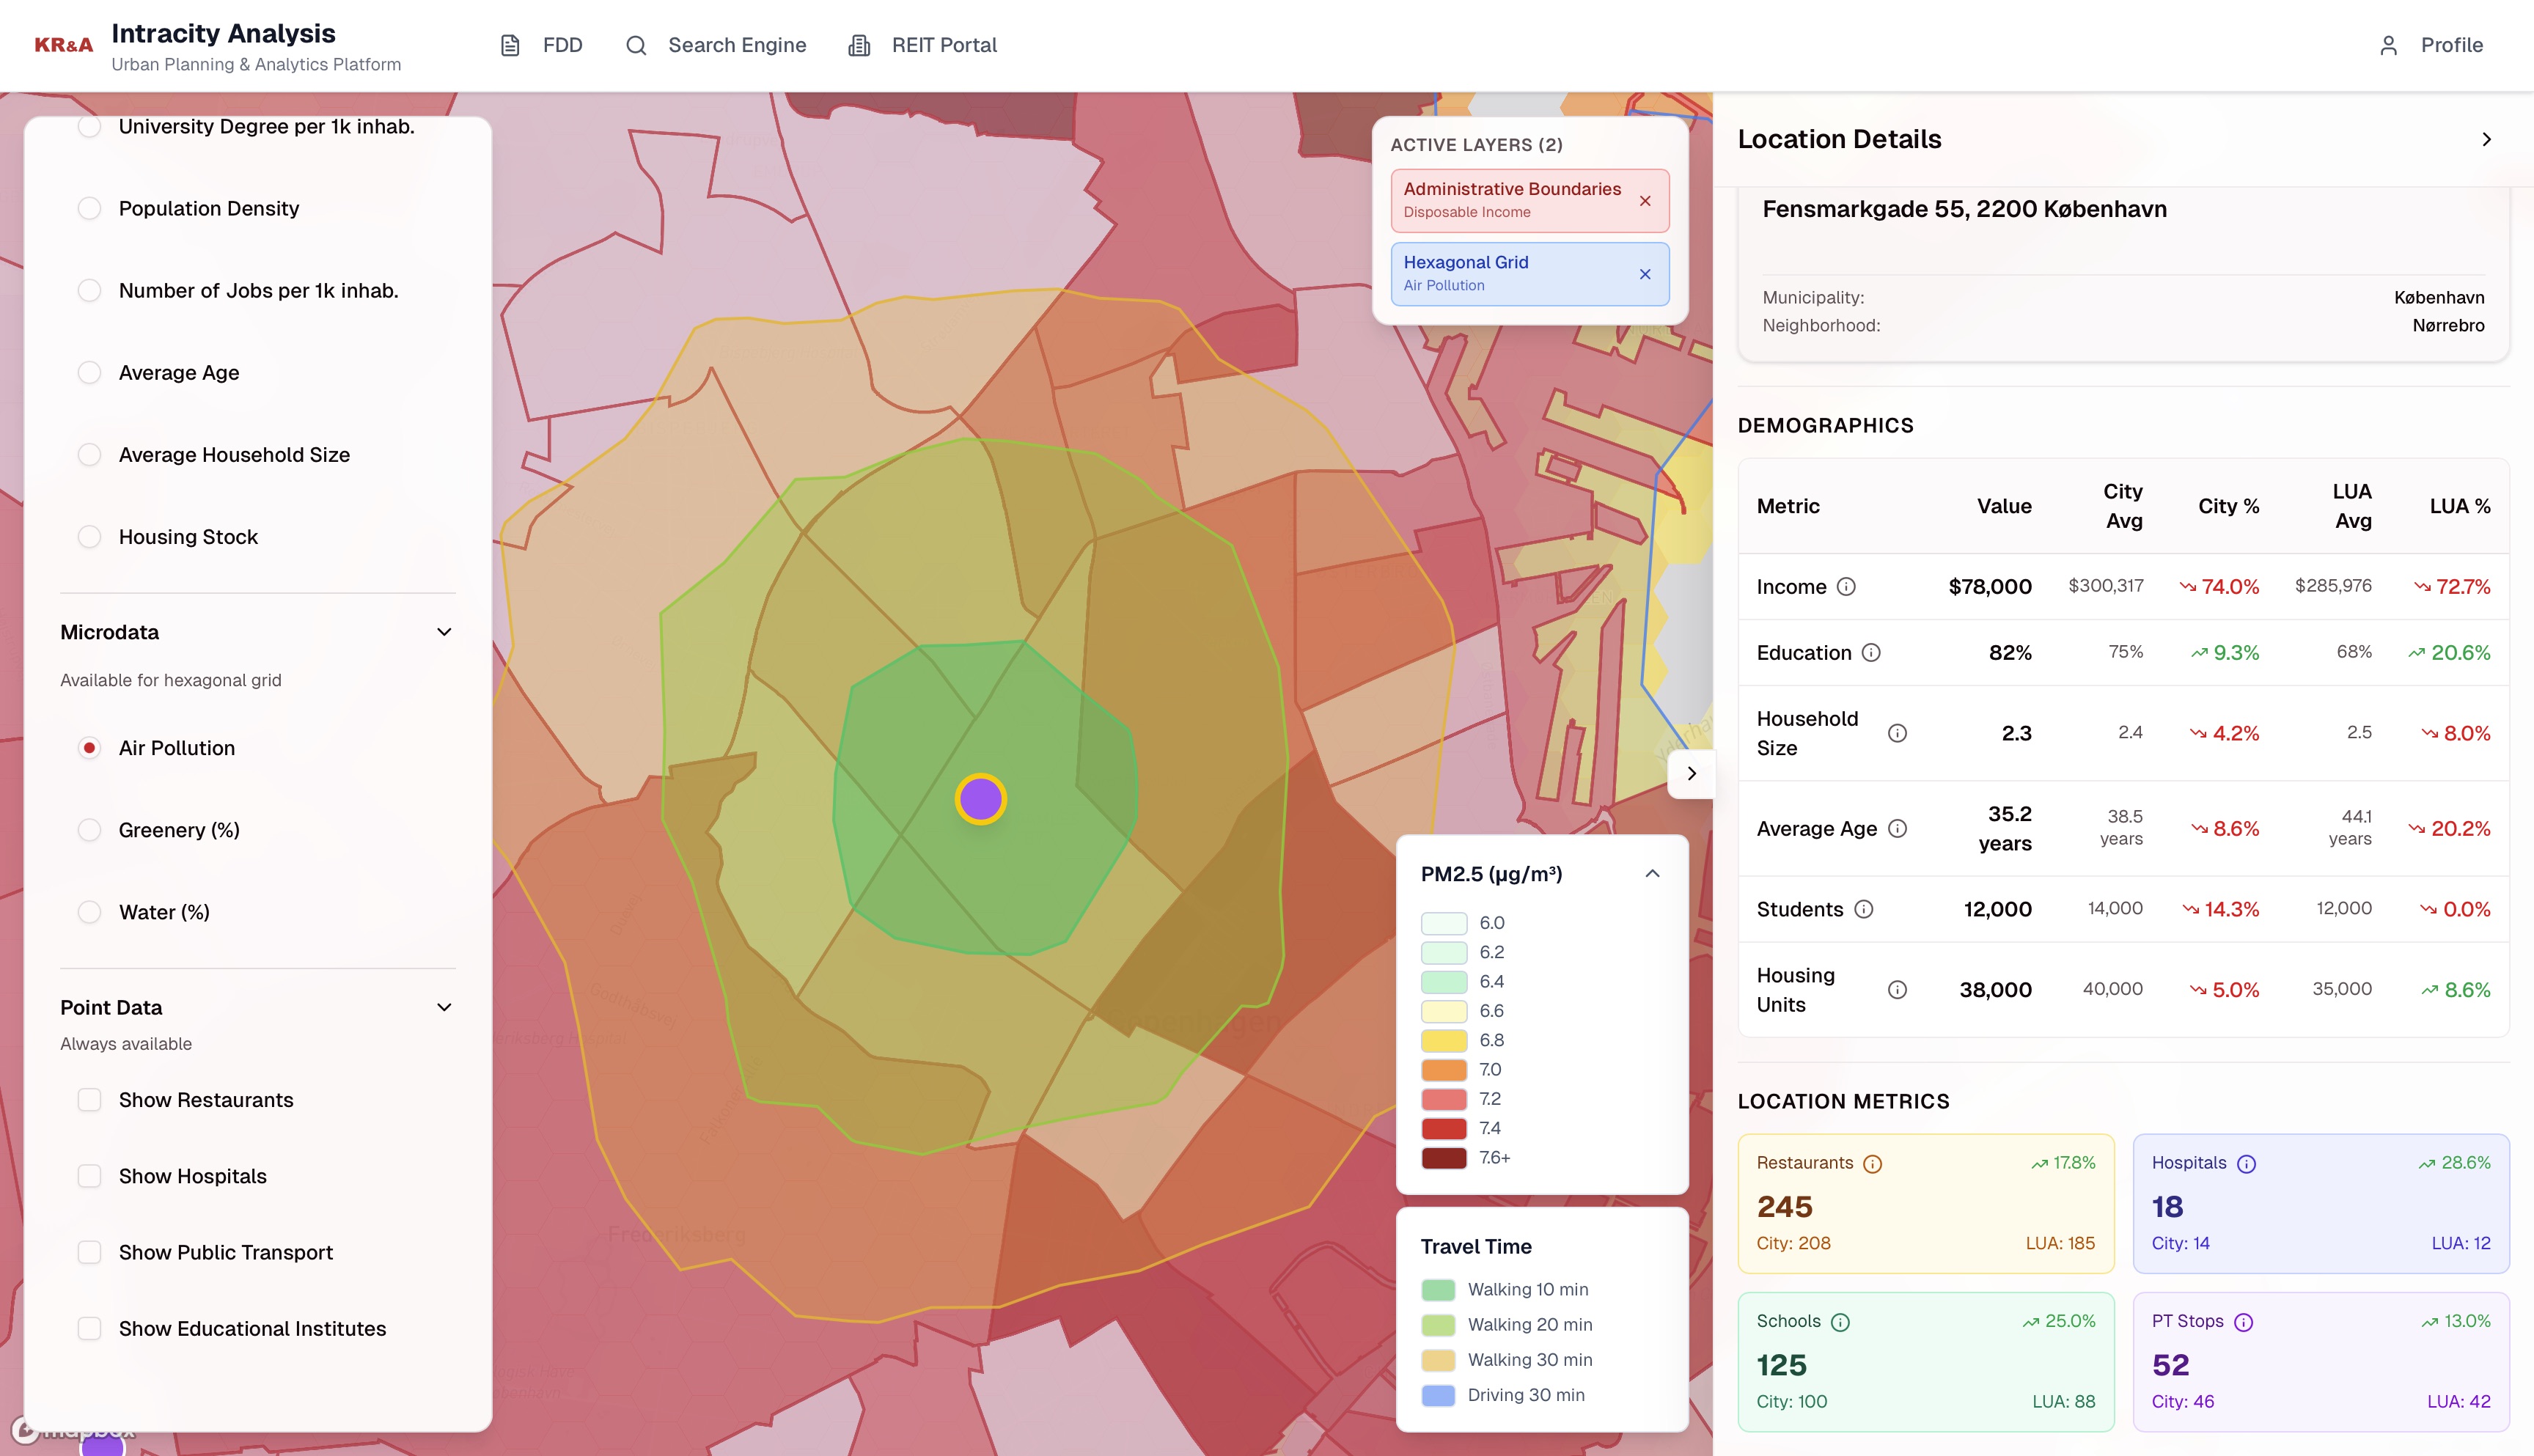
Compare specific locations or neighborhoods against the entire city or the complete Large Urban Area (LUA) on all of the socio-demographic, POI and thematic maps to decide whether a certain location in the city is better than the other. This can help in your due diligence of a certain city you are not completely familiar in.
- •Compare specific locations for microdata analysis
- •Directly find differences between this location and the rest of the city or LUA
- •Due diligence on unknown cities in an instance.
Access by dashboard or PDF
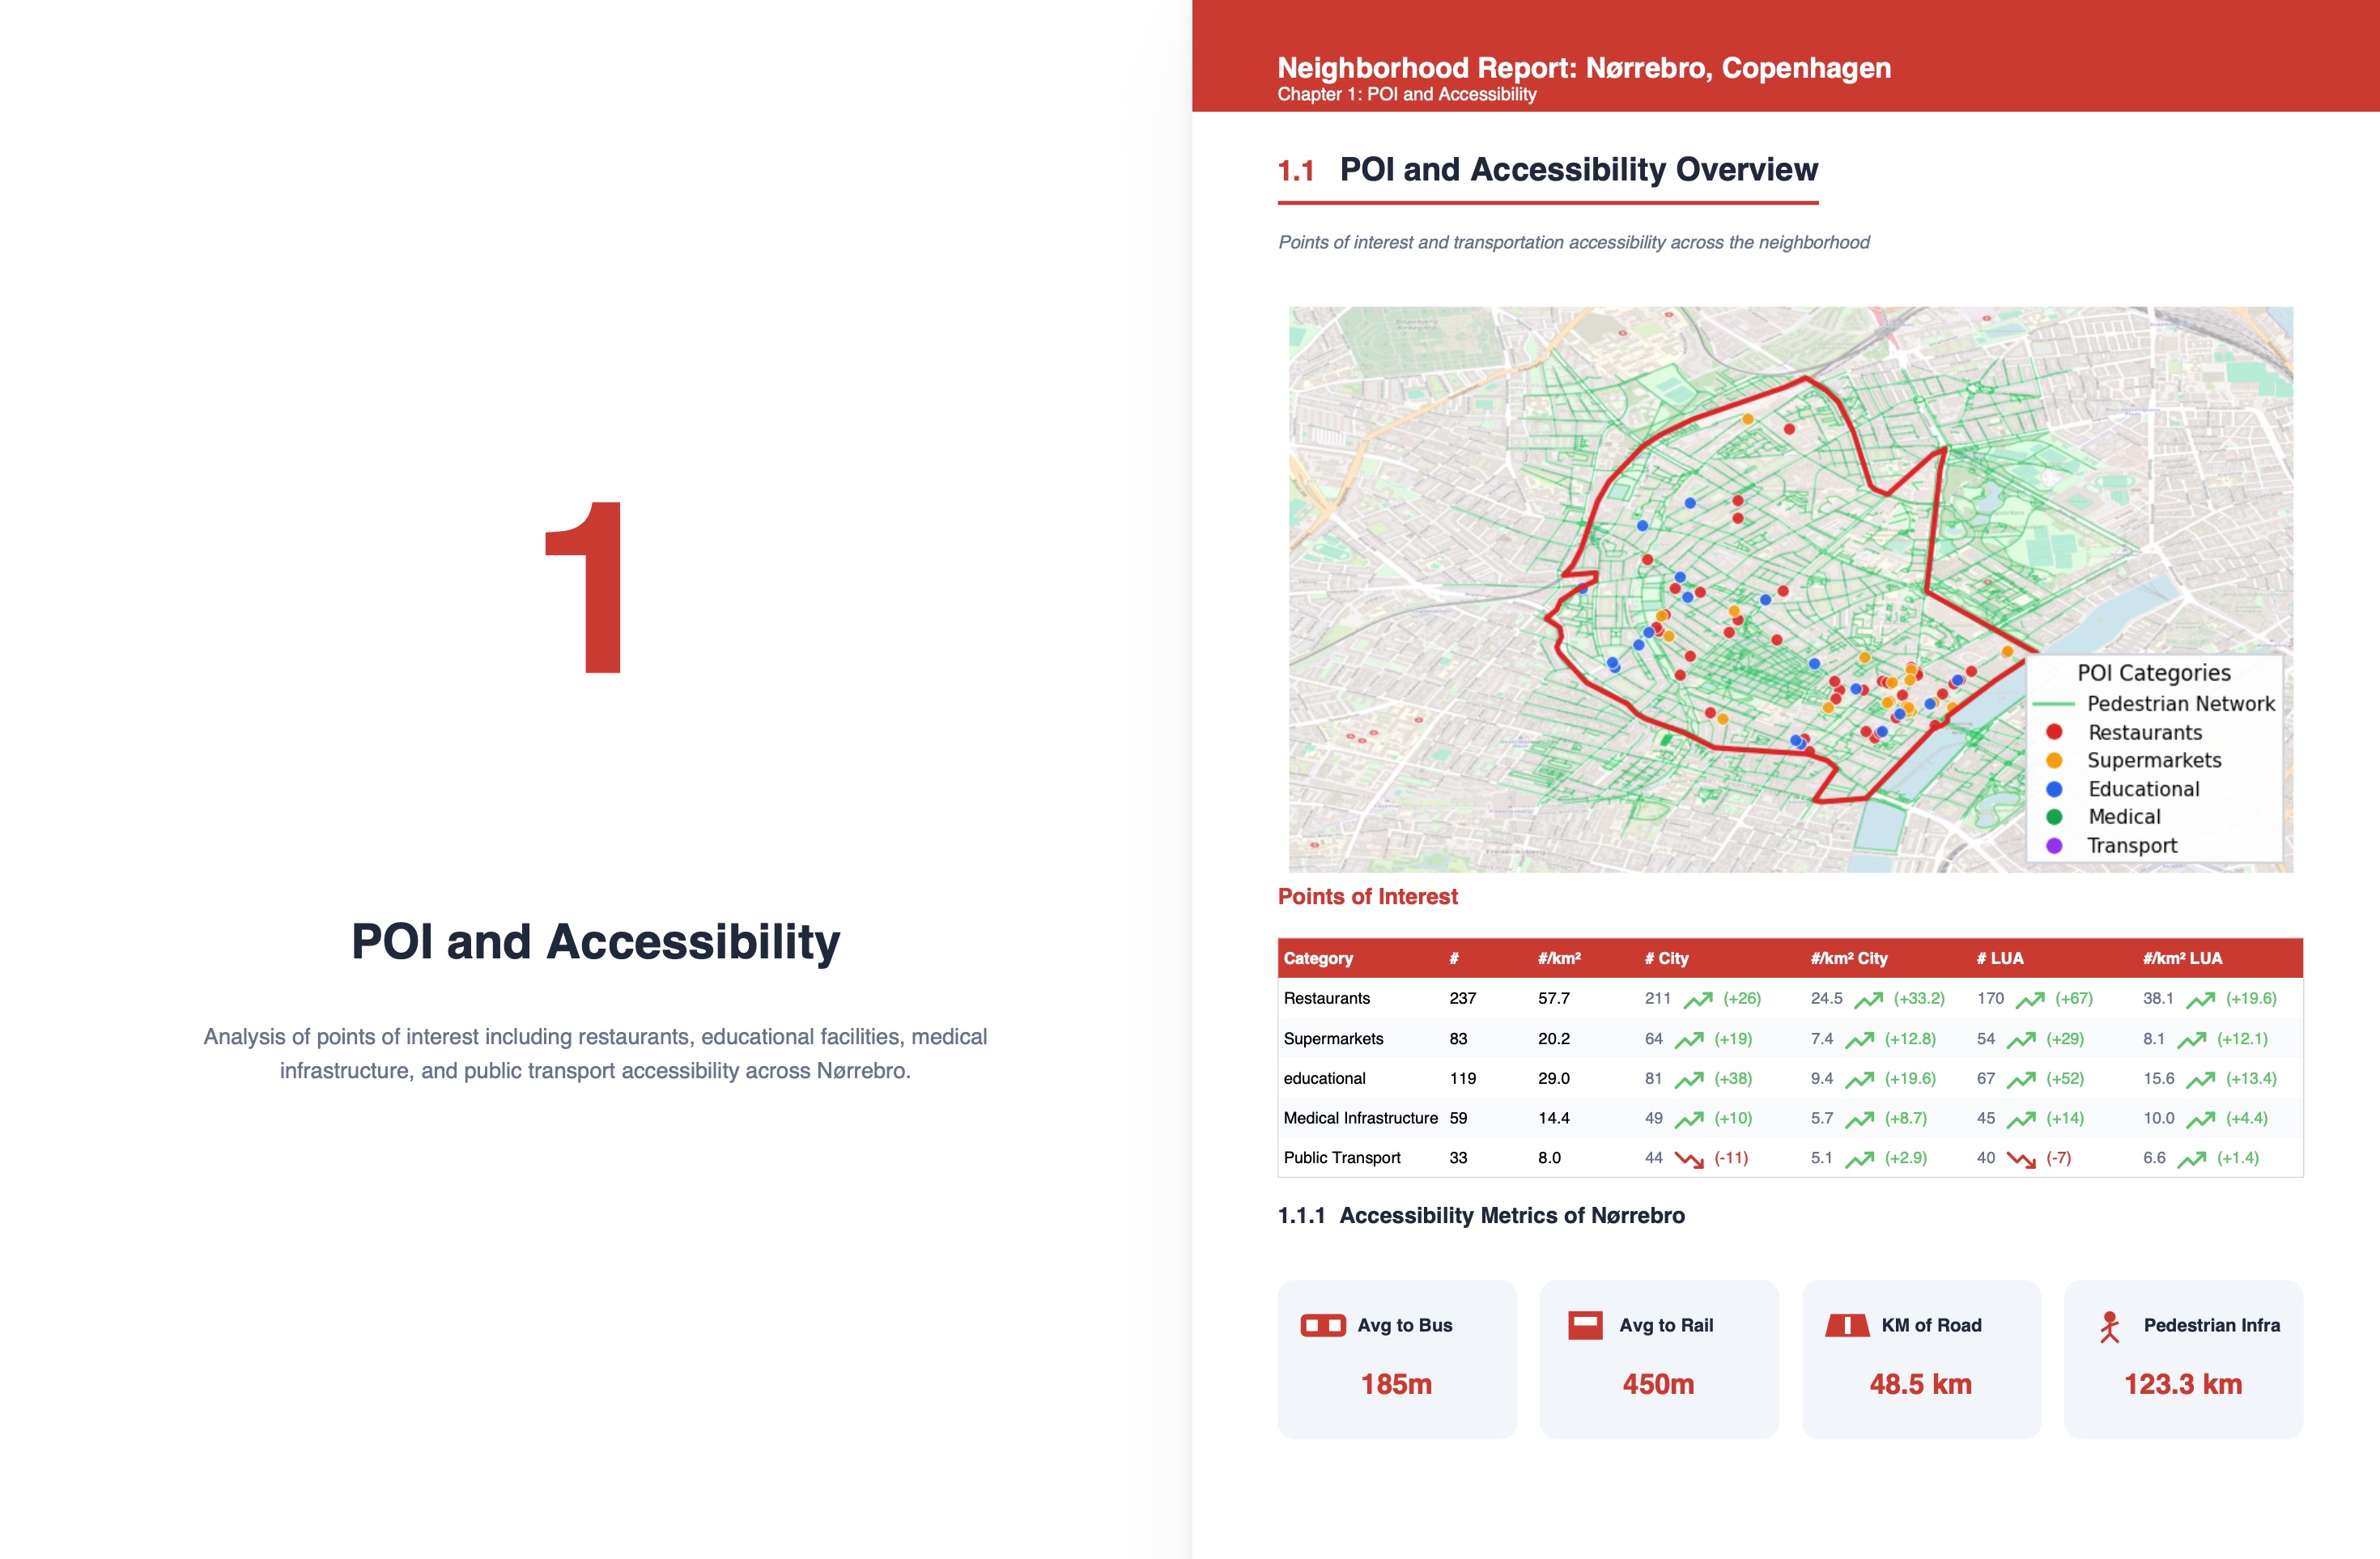
Besides the interactive dashboard, insights can also be provided in flat data or PDF format. This way this data can fit in your own decision process, whatever you decide to use.
- •Interactive dashboard to understand the internals of a city
- •Use the data to display on your own dashboards or run analyses on
- •Get a PDF report of a specific location or neighborhood or a city analysis.
Use cases
Hyperlocal City Reports are built for teams that need local context beyond what macro research can deliver.
For acquisition teams
Shortlist target neighbourhoods before visiting a city. Acquisition teams use Hyperlocal City Reports to rank micro-locations by investment potential, filter by tenant profile fit, and compare areas side-by-side, reducing site-visit lists to only the most promising options.
For asset managers
Monitor the neighbourhood dynamics around existing holdings. Asset managers track demographic shifts and neighborhood developments to decide when to invest in capex, reposition a property, or prepare for a sale, all backed by objective, continuously updated data.
For research teams
Produce city-level market studies with granular, standardised data. Research teams use the platform to compare European cities within and between each other on the same metrics to create an unbiased view of what areas and neighborhoods are. This can then support investment committees with location-specific evidence.