RED REports
Custom analysis on European REITs delivered within days with supplementary data.
Key characteristics
REITs covered
Comprehensive tracking of European listed REITs with real-time performance data and analytics.
Year history for REIT dynamics
Track dividend distributions, payout ratios and forecast future yield across your portfolio.
Asset attributes
Every asset in the tracked REIT portfolios is enriched with more than 100 attributes for peer comparison.
Data clusters
All data is clustered and normalised into clusters that allows easy comparison of portfolios.
Research any REIT portfolio
Our REIT analysis platform aggregates data from 70 European real estate investment trusts, combining regional data with microdata into a unified analytics engine. In this dashboard one can compare assets and portfolios to each other using normalised scores. Fund managers and institutional investors use it to make informed decisions based on location specific metrics, aggregated to fund level.
The platform tracks location-based data for the assets inside of the REIT, such as climate risk, flooding, labour markets or internet access.
Core data points
Portfolio metrics
- •Total Returns: Cumulative gains including dividends and capital appreciation
- •Dividend Yield: Annual dividend payout as percentage of current price
- •Price-to-NAV Ratio: Current trading price vs Net Asset Value
- •Funds From Operations (FFO): Cash flow metric specific to REITs
- •Debt-to-Equity Ratio: Leverage and financial stability analysis
Market analysis
- •Sector Allocation: Distribution across residential, commercial, industrial, and healthcare
- •Geographic Exposure: Regional diversification across European markets
- •Peer Benchmarking: Performance comparison against similar REITs
- •Volatility Index: Historical price movements and risk assessment
- •Correlation Analysis: How holdings move together during market shifts
Portfolio dashboard
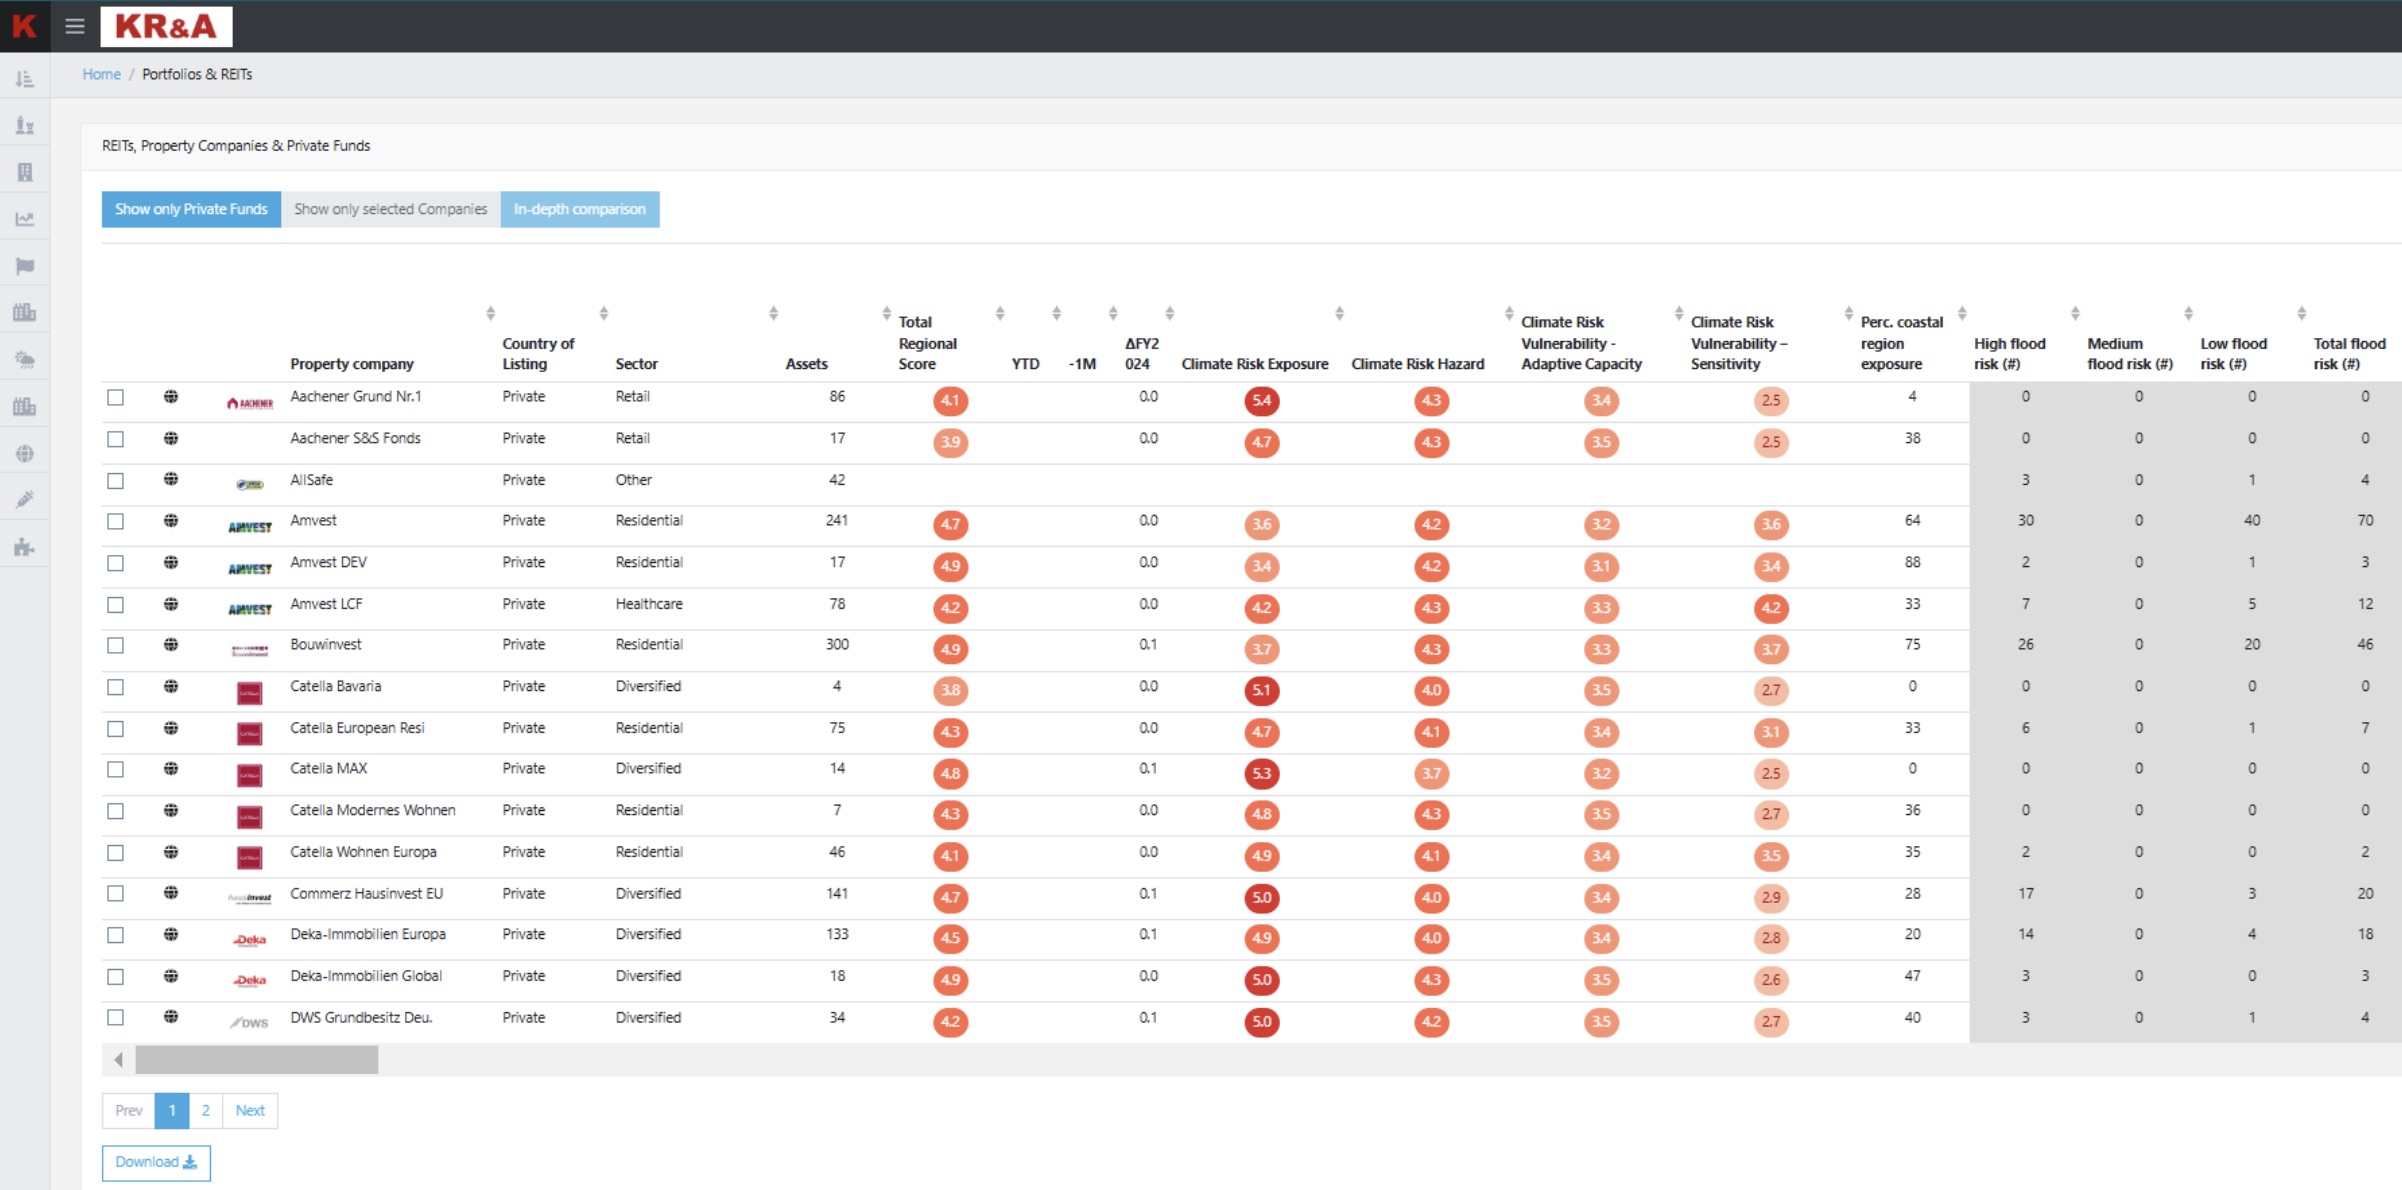
Compare REIT Portfolios by the KR&A scores, including regional data, climate risk and microdata such as restaurants in the area, labour markets etc.
- •NUTS Data divided into 9 clusters
- •Climate Risk Data and Microdata
- •Normalised scores over regions or portfolios (1-6)
Geographic representation
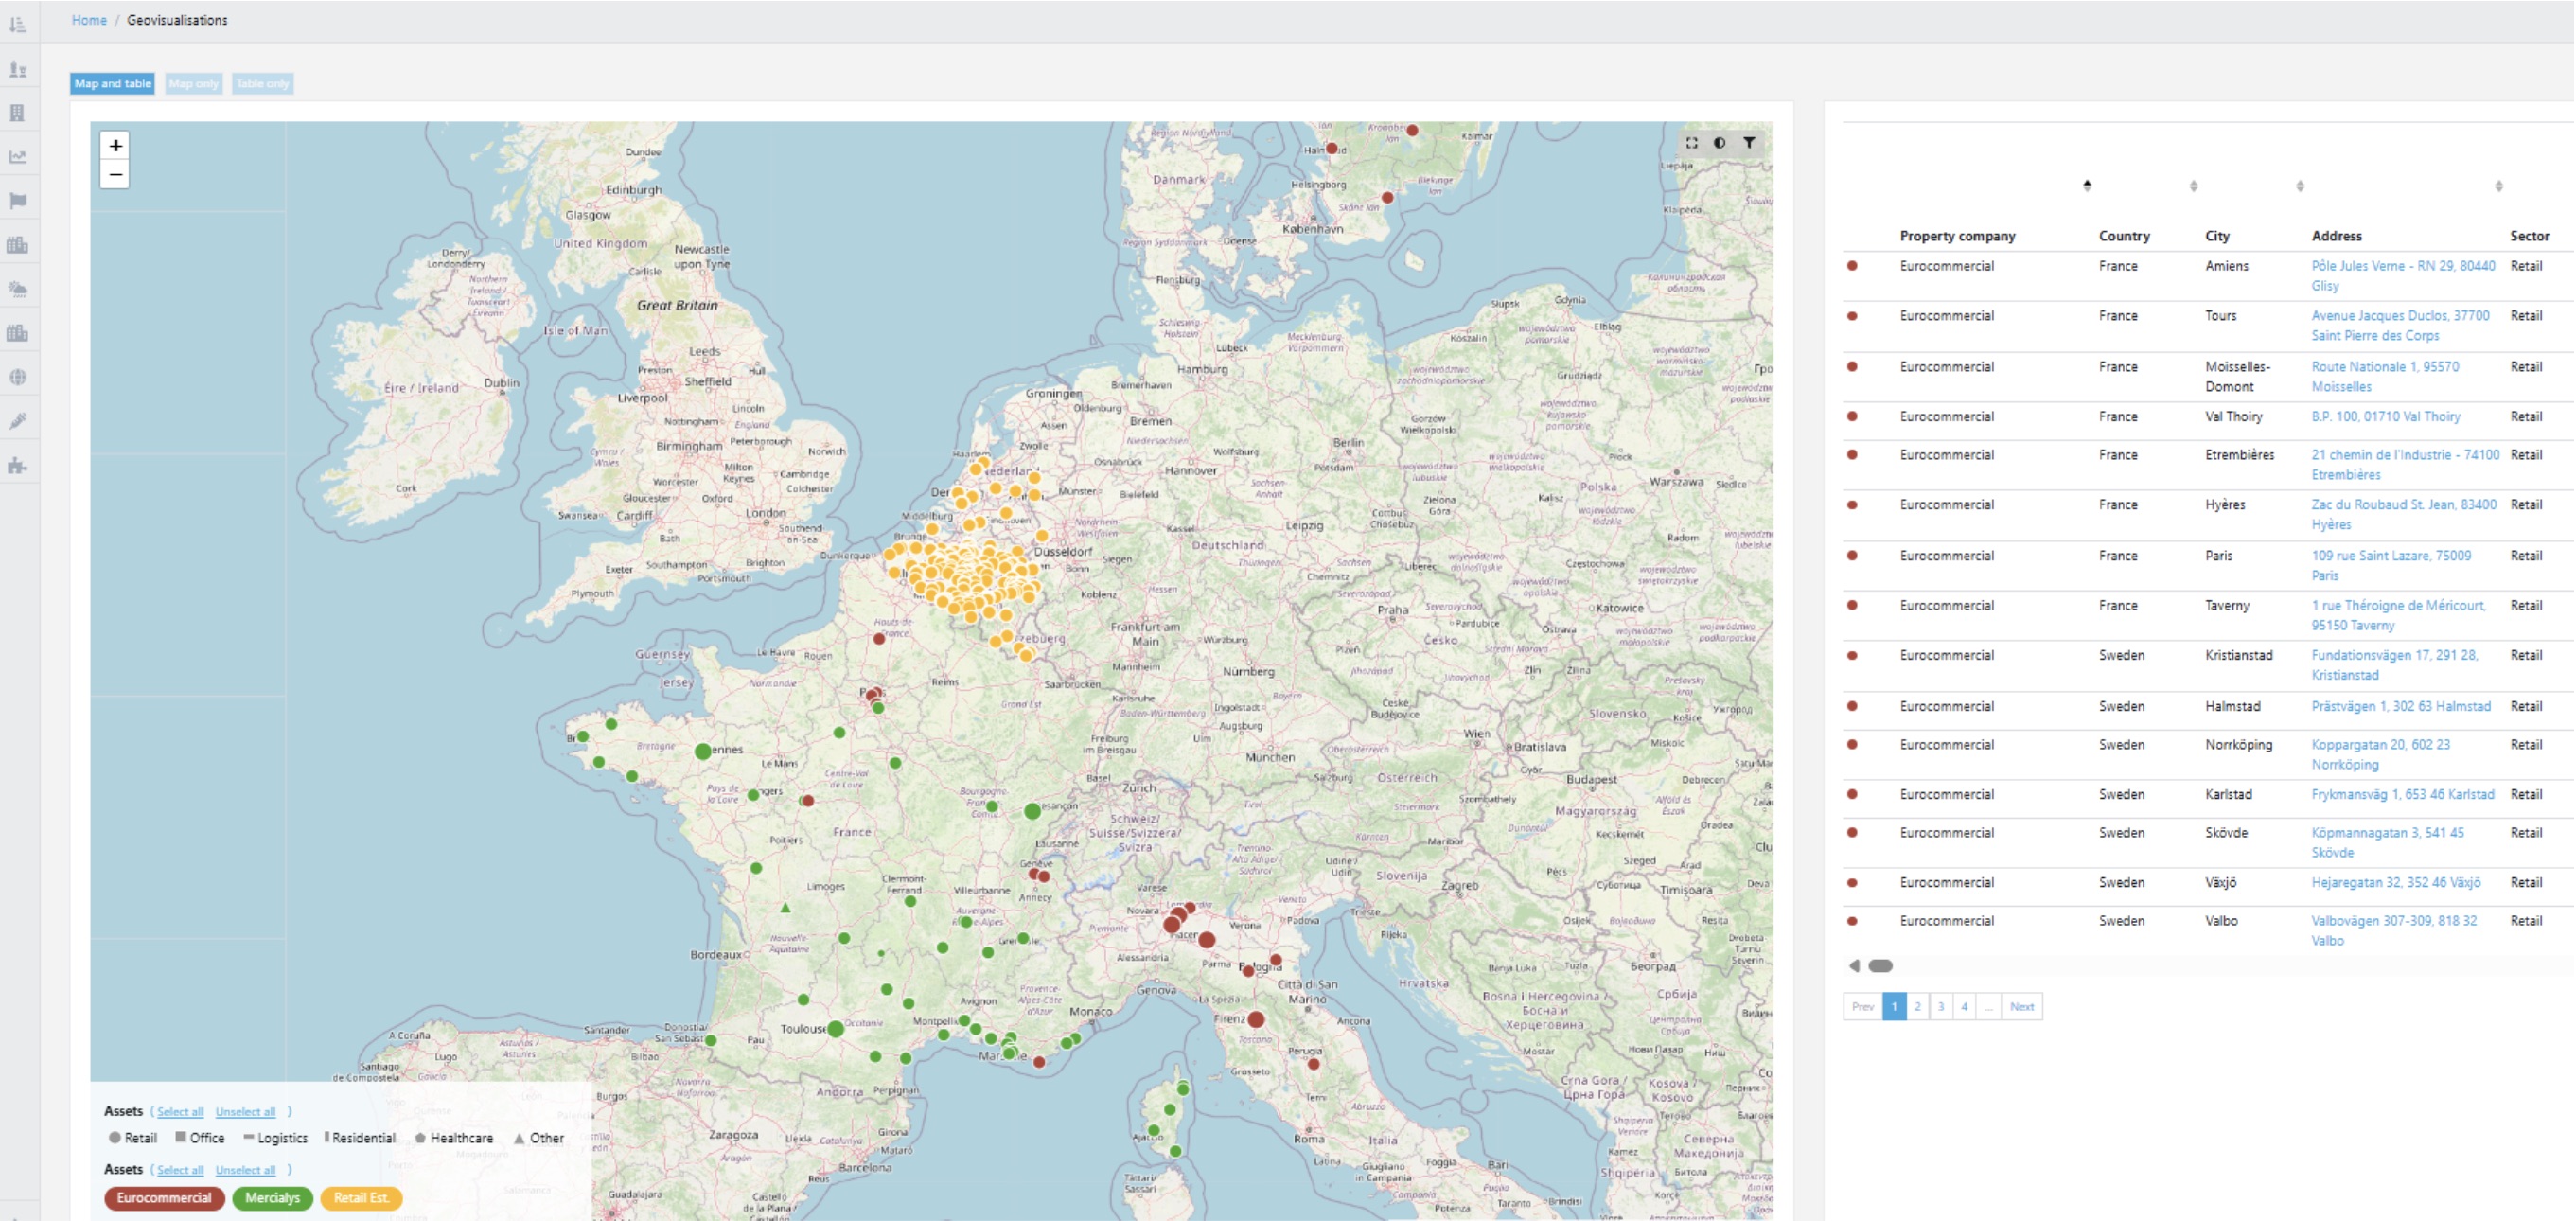
Plot all of the assets for the funds on a map to see the geographic exposure and plot regional data to coeasily compare the different data. This way investors get an immediate view of their exposure.
- •Plot all assets of funds
- •Visualise the assets on top of regional data
Regional data
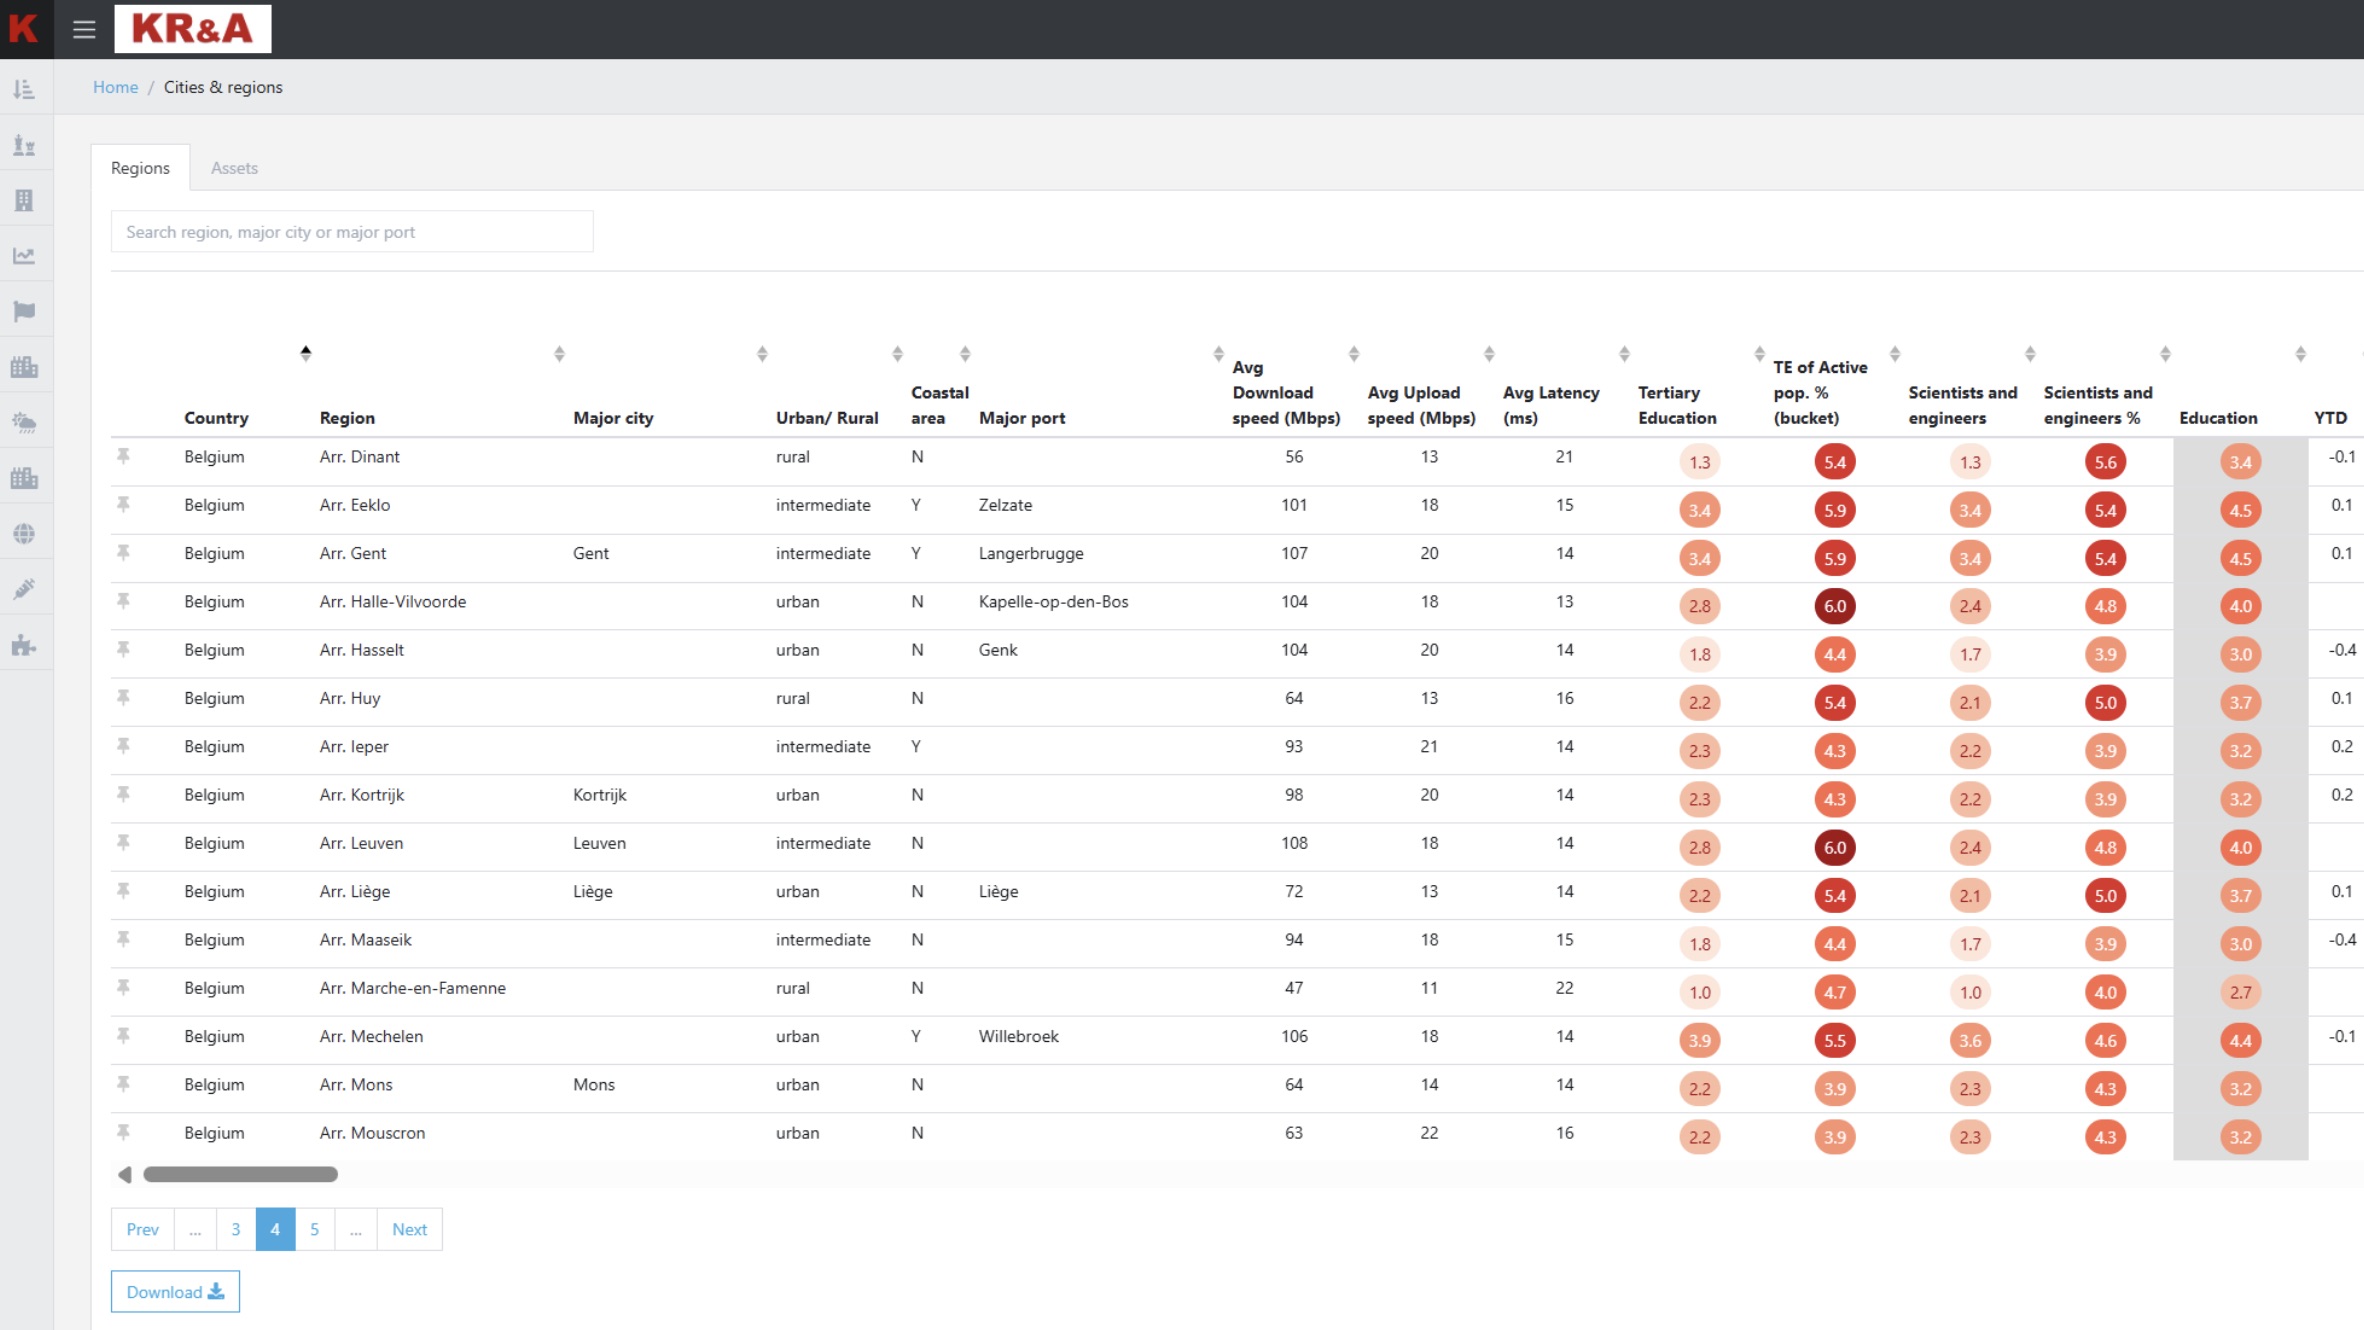
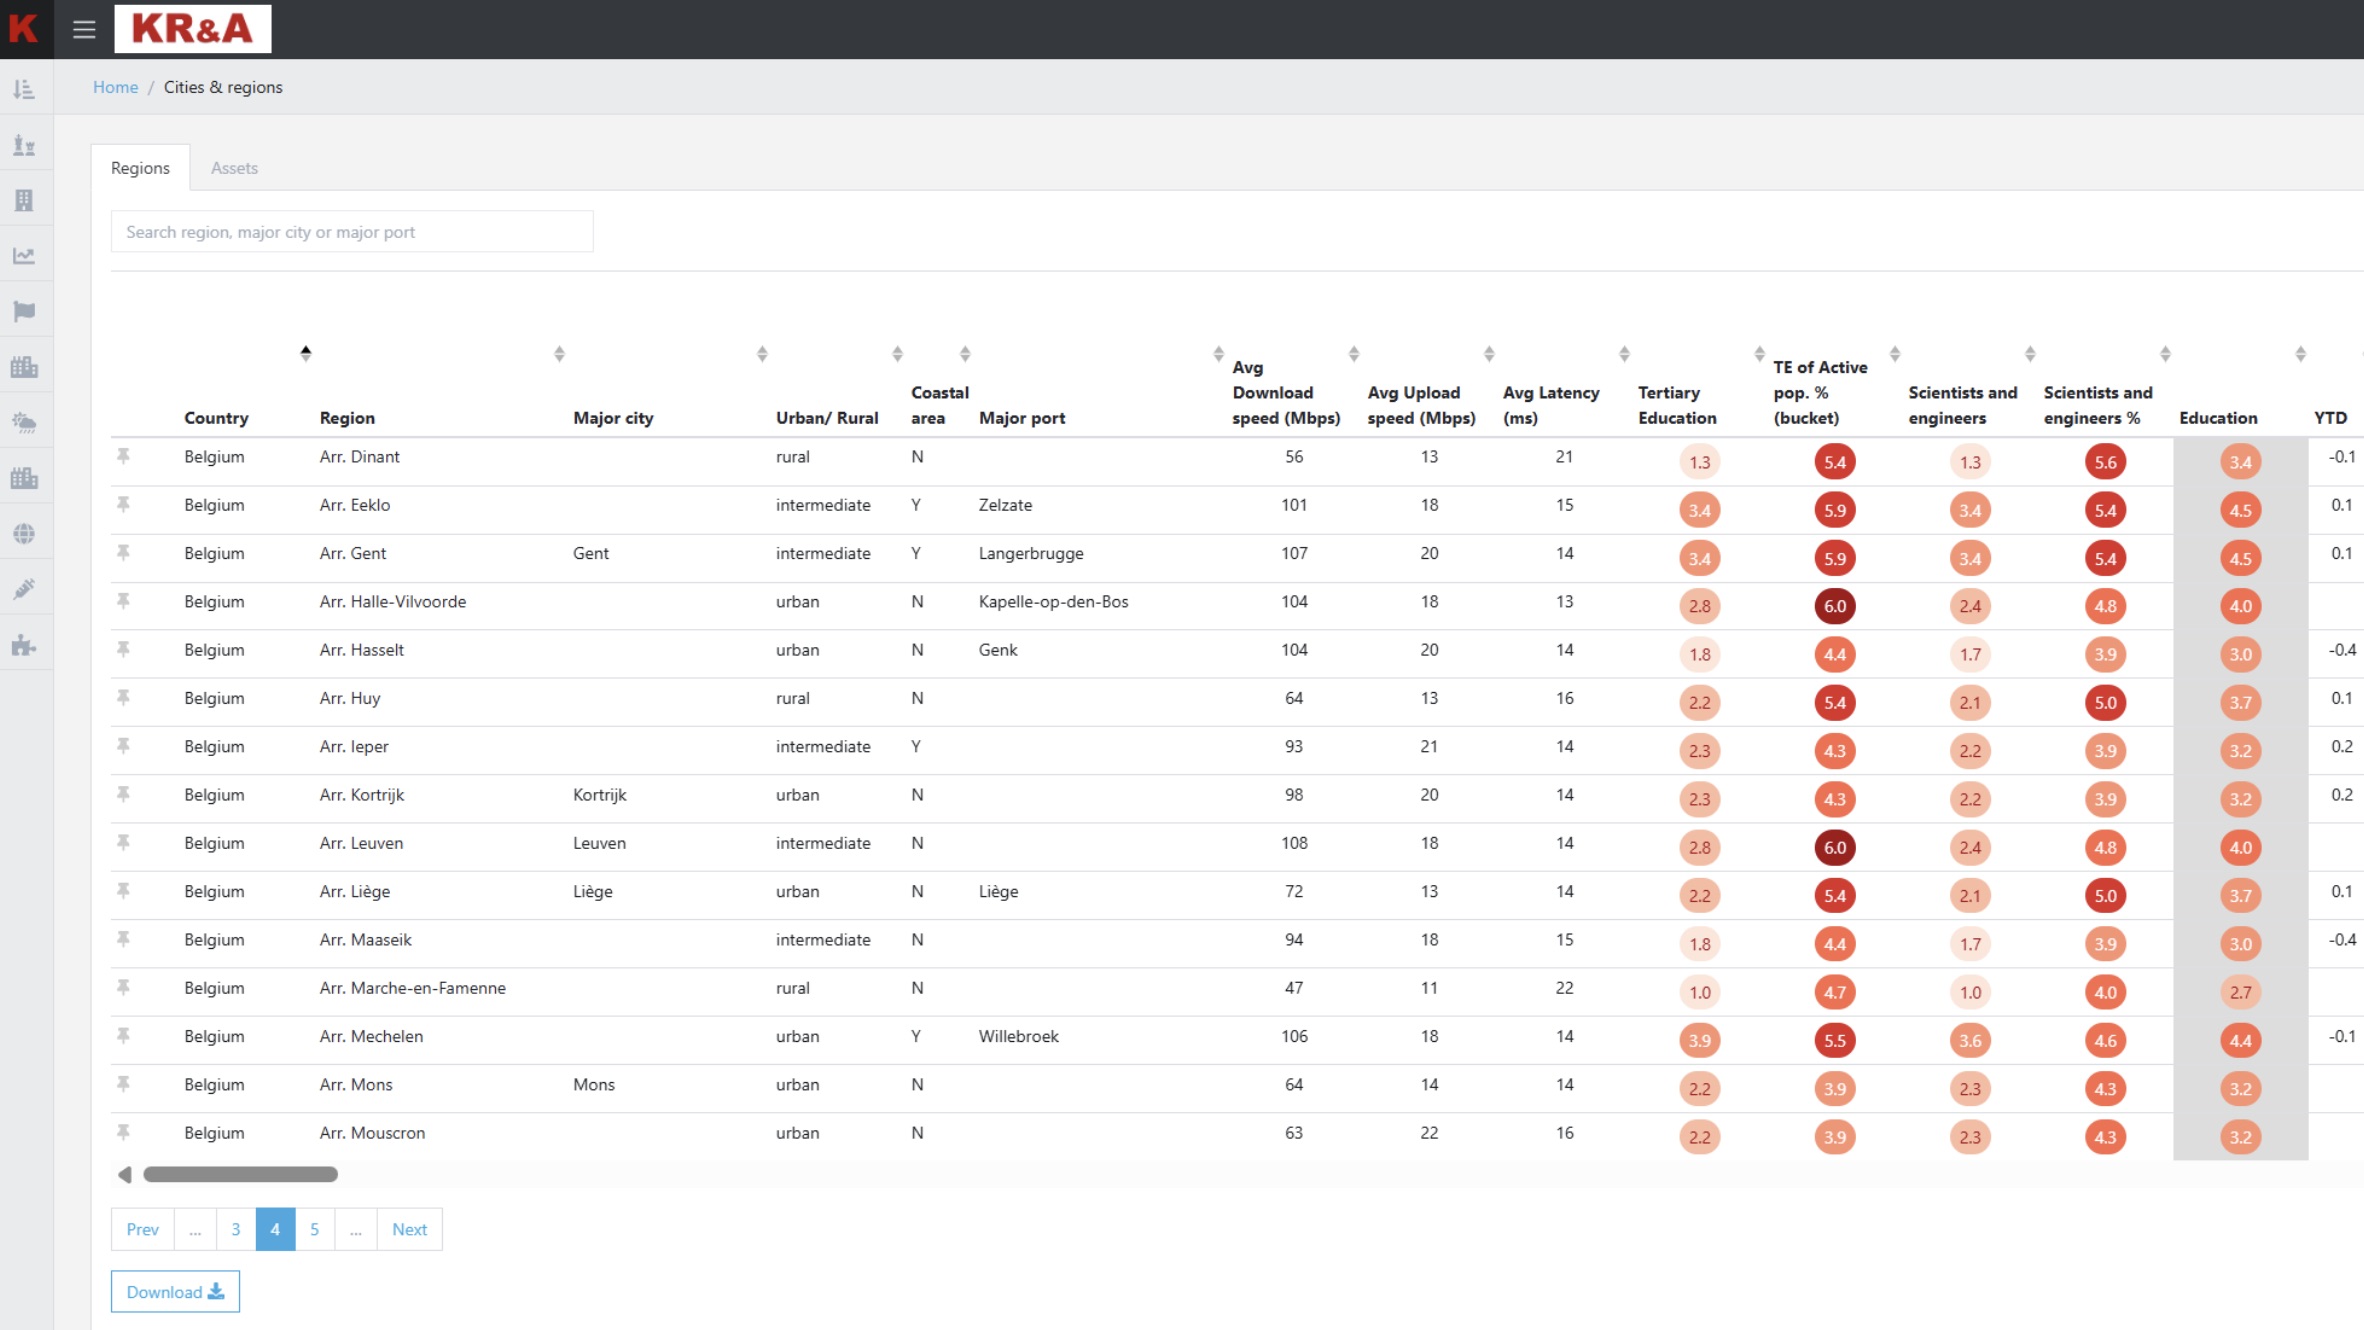
Analyse normalised NUTS data to quickly find regions that are objectively better than other regions based on KR&A's data.
- •Normalised regional data over all regions
- •Compare regions quickly
Use cases
RED REports serves a broad range of institutional and professional investors. Here is how different teams leverage the platform.
For institutional allocators
Evaluate REIT exposure within a multi-asset portfolio. Allocators use the platform to compare listed real estate against direct property, bonds, and equities, ensuring the REIT allocation delivers the desired risk-return profile and diversification benefits across market cycles.
For fund-of-fund managers
Screen, compare, and monitor REIT funds against each other. The peer benchmarking engine surfaces relative value within the listed real estate universe, helping managers construct and rebalance fund-of-fund portfolios with conviction.
For equity analysts
Accelerate REIT coverage initiation and maintenance. Analysts use the platform to pull standardised financial data, build peer comparisons, and generate sector overviews, freeing time for qualitative research and client interactions instead of manual data gathering.
For risk and compliance teams
Monitor concentration, leverage, and liquidity risks across a REIT book. The risk module delivers automated exposure reports, threshold alerts, and scenario outputs that integrate directly into existing compliance workflows and board reporting.